Interim docs for Apache Superset to help you get dashboards up and running. The following instructions are valid for tabular data only (csv, xls etc).
From a Resource, Click “Visualise” to go to Superset. (Image 1)
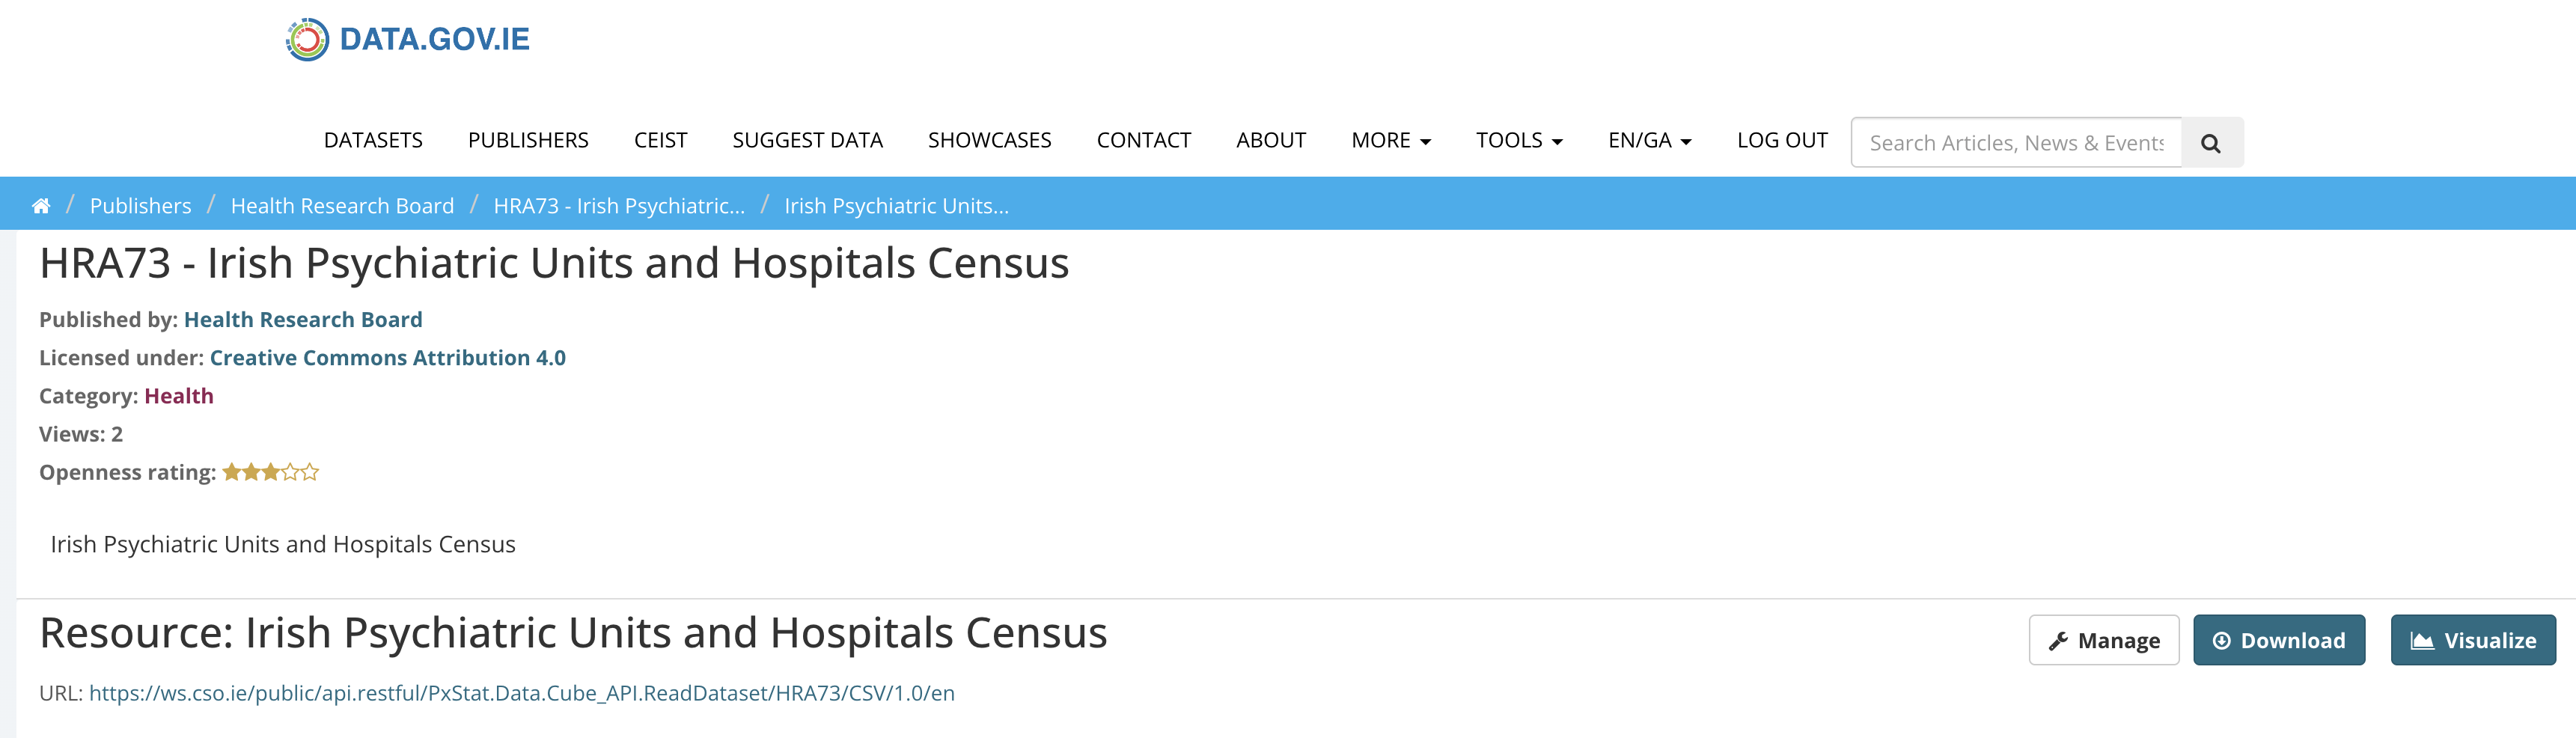
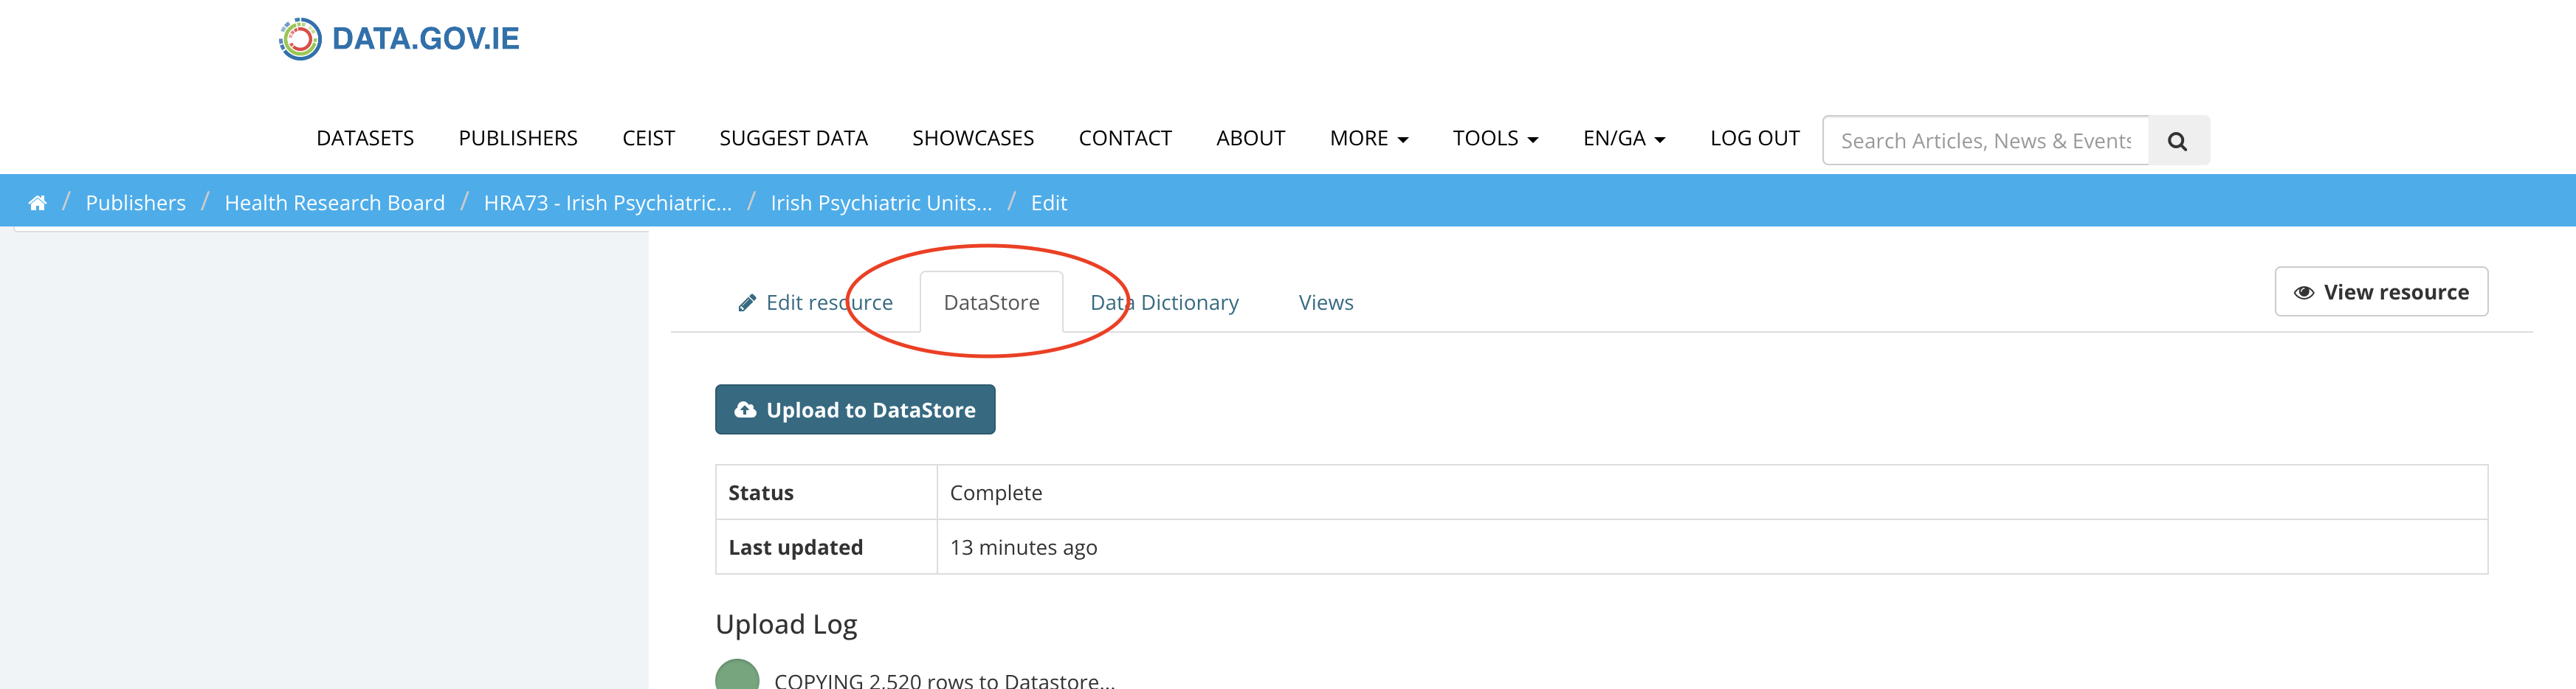
If there’s no Visualise button yet, the Resource needs to first be put into the Datastore. Go to “Manage” then the Datastore tab. (Image 2)
“Visualise” takes you to Superset with the resource preselected and the various chart options available to you. You can follow the official docs from here: intro | Superset
Once you have created a chart, you’ll next need to create a Dashboard to add that chart to.
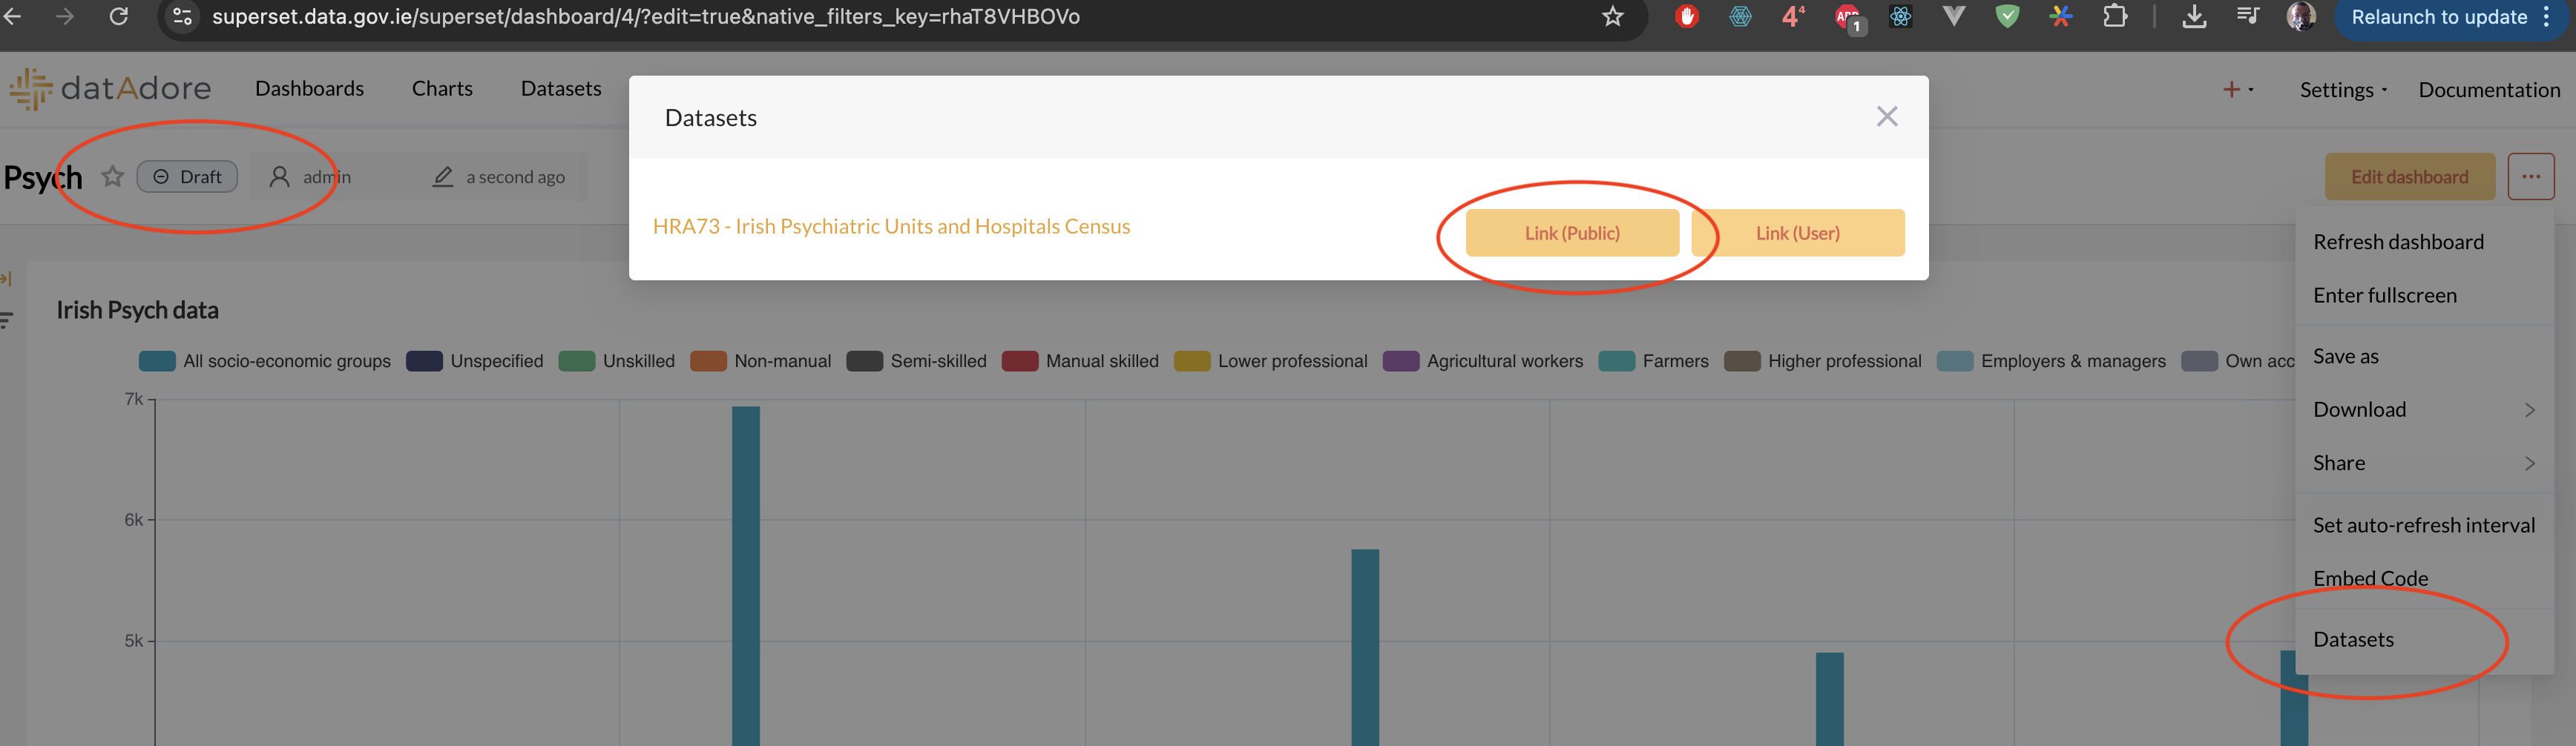
Save the Dashboard and there’s one final step to get it to appear on DGI. (Image 3)
Link the Dashboard to the Dataset either Public (to appear on the dataset for everyone) or User (only for you). Set the Dashboard to “Published”.